Play the sales status using various indexes to view it from the dashboard.
Retrieved data is shown in visual format, e.g., graphs and a table, so that you can obtain an intuitive view of overall sales status by period.
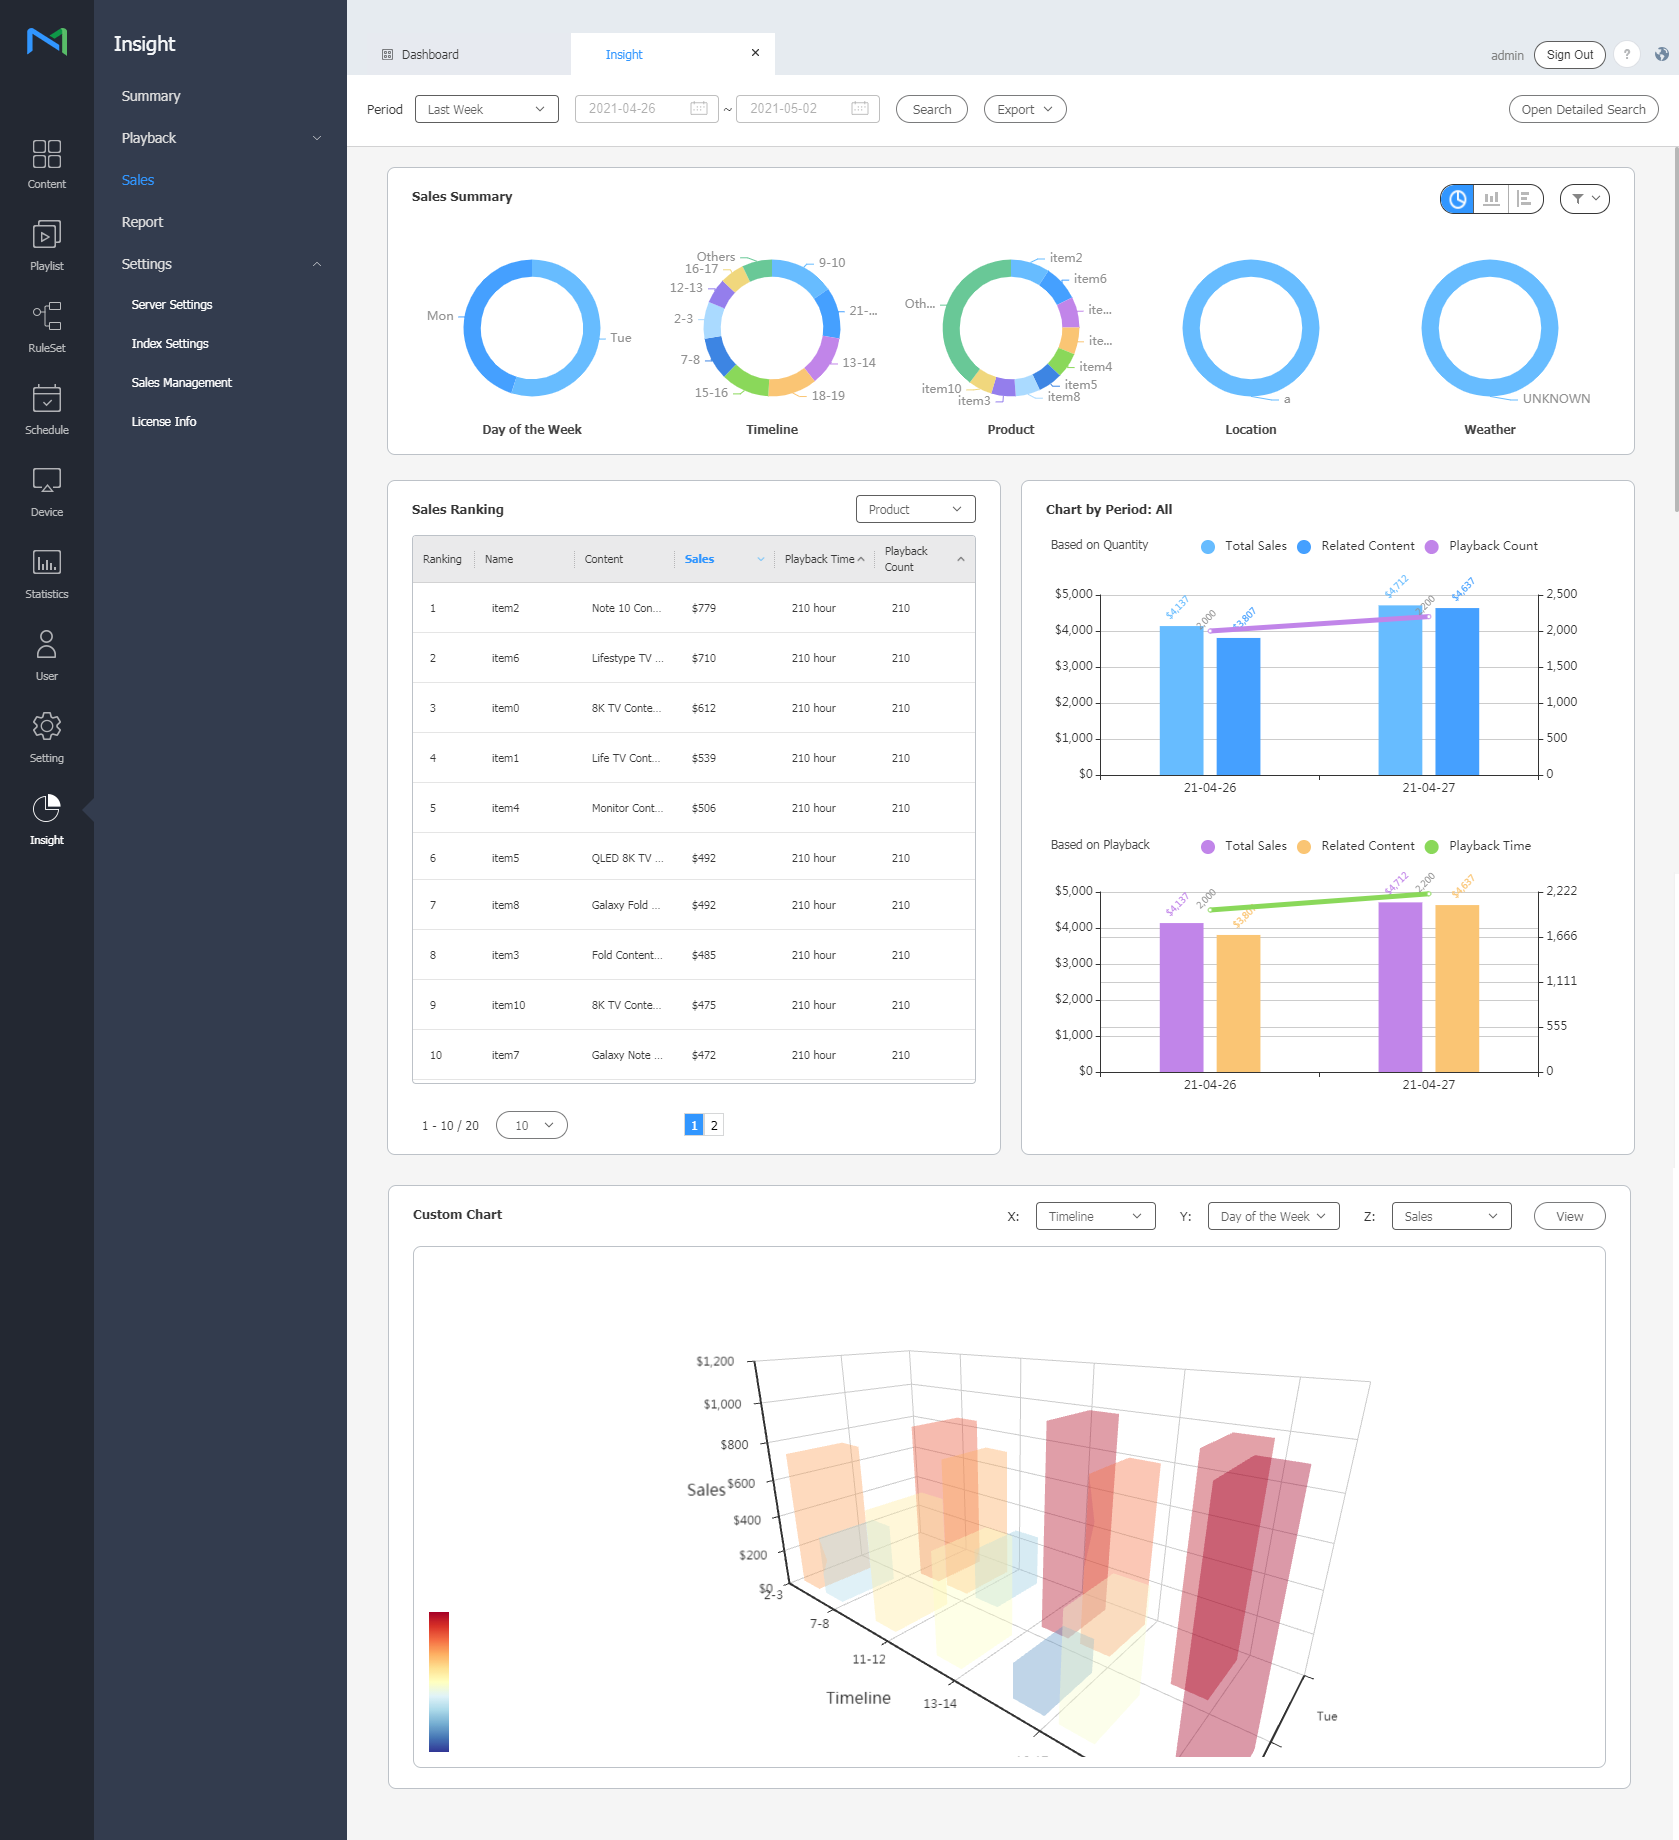
- From the menu bar on the Insight screen, click Sales .
- Set the analysis period in the search area at the top. Analysis result is displayed based on the period specified in Settings > Index Settings > Date Range .
- Click Search . The statistics that match the search conditions are presented in graphs and a table.
-
To save retrieved statistics as a PDF or HTML file click Export .
Note
- To select all sales items or analyze specific sales items, click Open Detailed Search. It is possible to select a maximum of three specific device groups or key indexes, as well as an analysis period. It is also possible to analyze data collected for a maximum of 60 days within the last two years.
- Logs and processed data are retained for a maximum of two years.
Details of sales status that can be viewed are as follows.