Versions Compared

Key

  • This line was added.
  • This line was removed.
  • Formatting was changed.
Comment: Content imported from a Scroll Translations translation file.
Sv translation
languageko_KR

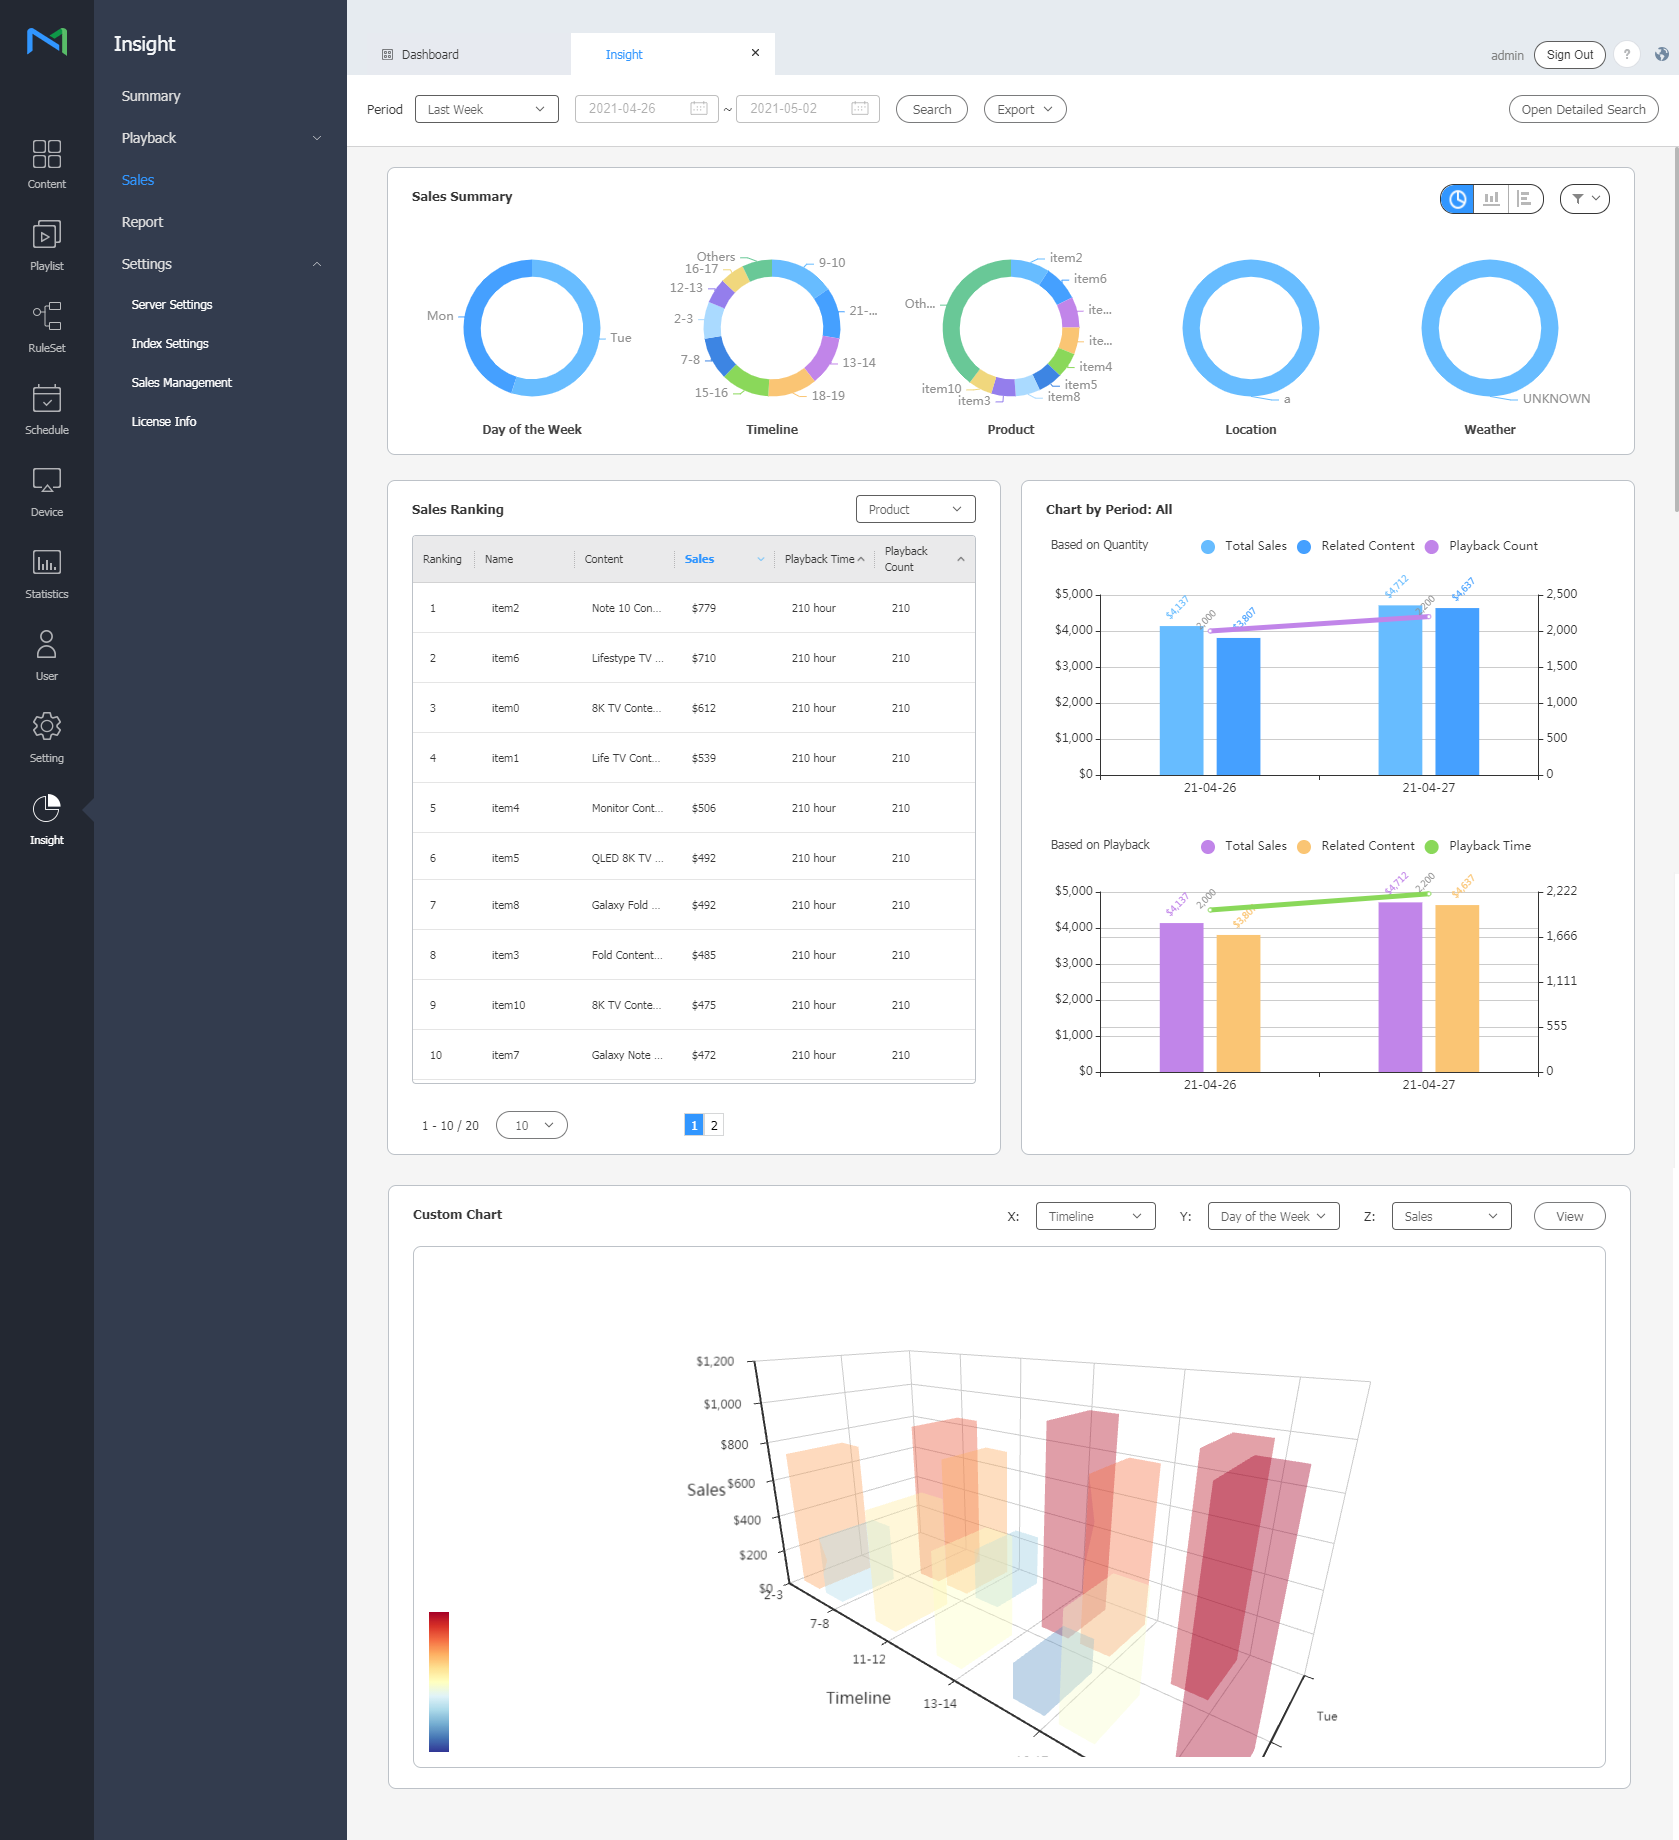
매출 현황을 다양한 지표로 재생하여 대시보드에서 확인할 수 있습니다.

조회된 자료는 그래프와 표 등 시각화 자료로 구현되어 전체 매출 현황을 기간별로 한눈에 파악할 수 있습니다.

Stylesheet
classscreen

Image Modified

  1. Insight 화면 메뉴바에서 매출을 클릭하세요.
  2. 위쪽의 검색 영역에 분석할 기간을 설정하세요. 분석 기간은 설정 > 지표설정 > 날짜범위에서 선택한 기간을 기준으로 표시됩니다.
  3. 검색을 클릭하세요. 검색 조건에 일치하는 통계가 그래프와 표로 나타납니다.
  4. 조회된 통계를 PDF나 HTML 파일로 저장하려면 내보내기를 클릭하세요.

    Info
    title참고
    • 전체 매출 현황을 선택하거나 특정 매출 현황만 분석할 경우, 상세 검색 열기를 클릭하세요. 분석 기간 외에도 장치 그룹, 주요 지표를 3개까지 선택할 수 있으며 2년 내 최대 60일간 자료를 분석할 수 있습니다.
    • 로그 및 처리된 데이터의 최대 저장 기간은 2년입니다.

‘매출 현황 살펴보기’에서 다루는 내용은 다음과 같습니다.

Children Display

Sv translation
languageen

Play the sales status using various indexes to view it from the dashboard.

Retrieved data is shown in visual format, e.g., graphs and a table, so that you can obtain an intuitive view of overall sales status by period.

Stylesheet
classscreen

Image Added

  1. From the menu bar on the Insight screen, click Sales .
  2. Set the analysis period in the search area at the top. Analysis result is displayed based on the period specified in Settings > Index Settings > Date Range .
  3. Click Search . The statistics that match the search conditions are presented in graphs and a table.
  4. To save retrieved statistics as a PDF or HTML file click Export .

    Info
    titleNote
    • To select all sales items or analyze specific sales items, click Open Detailed Search. It is possible to select a maximum of three specific device groups or key indexes, as well as an analysis period. It is also possible to analyze data collected for a maximum of 60 days within the last two years.
    • Logs and processed data are retained for a maximum of two years.

Details of sales status that can be viewed are as follows.

Children Display