


Using the Power BI App
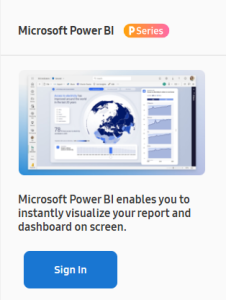
VXT Canvas supports the Power BI App for business. Link your VXT screen to Power BI
and display your report and dashboard from your Power BI on the screen.
Follow the steps below to use the Power BI App.
-
Samsung VXT CMS only provides pairing with the user's Power BI account for displaying content on a Signage device, and is not involved in actual data processing.
-
All data is processed according to the terms of use and privacy policy of Microsoft.
-
Samsung is not involved in any Power BI content and assumes no responsibility for Power BI content unrelated to Samsung.
Presets (Account Preparation)
To use the Microsoft Power BI App, first, you need to create a Microsoft organizational account that is connected to Power BI using the procedure provided below.
1. Creating a Microsoft Organization account
If you do not have a Microsoft organizational account, follow the steps below to create one:
-
Go to the Microsoft sign-in page.
Visit https://login.microsoftonline.com/ and click on "Create account" or "Sign up for an account".
-
Enter your organization's email address.
If you already have an organizational email address, enter it and follow the prompts to create a Microsoft account associated with your organization.
-
Create a new Microsoft account.
-
If you don't have an organizational email address, click on "Create a new account".
Enter your name, organizational email address, and password.
-
Verify your email address.
Check your email inbox for a verification link from Microsoft.
-
Agree to Microsoft's terms of service.
Review and agree to Microsoft's terms of service and privacy policy.
-
Set up your organization (if applicable).
If you're creating an account for an organization, you need to set up an Azure Active Directory (Azure AD) tenant. Visit https://portal.azure.com/ and sign in with your new account. Follow the prompts to create an Azure AD tenant for your organization.
-
For more information on creating a Microsoft organizational account, refer to the following webpage:
2. Registering for Power BI
To register for Power BI, you need a Microsoft organizational account. Follow the steps below to register for Power BI:
-
Sign in to Power BI.
Go to https://powerbi.microsoft.com/. Sign in with your Microsoft organizational account.
-
Check your license eligibility.
Ensure you have one of the following licenses;
Microsoft Fabric, Power BI Pro, Premium Per User (PPU)
-
Start your Power BI trial (if applicable).
If you don't have a license yet, you can start a free trial for Power BI Pro or Premium Per User (PPU). Click on "Start free trial" and follow the prompts to sign up.
-
Set up your Power BI workspace.
Once signed in, you'll be directed to your Power BI dashboard. Create a workspace to organize your reports, dashboards.
Sign in to Power BI (Using the App)
Signing in to Power BI
-
In VXT Canvas, click the Apps menu, then search for the Microsoft Power BI App and click it.
-
On the app information, click the Install button.
-
After the app is installed, click the Sign In button.
-
If you have any Microsoft organization accounts that are already logged in on the browser, select an account displayed under "Pick an account", or select "Use another account" to log in to another account.
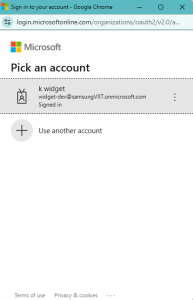 |
-
If there aren't any Microsoft accounts that are already logged in, please input the credentials of your Microsoft organization account. To use the Samsung VXT Canvas app with your logged-in Microsoft account, click the Accept button.
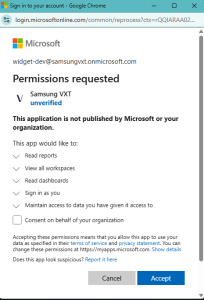 |
The Samsung VXT Canvas app has been connected to your Microsoft account.
How to Use the Power BI App
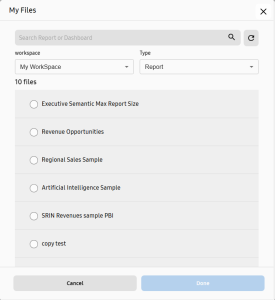
Selecting a Power BI report or dashboard
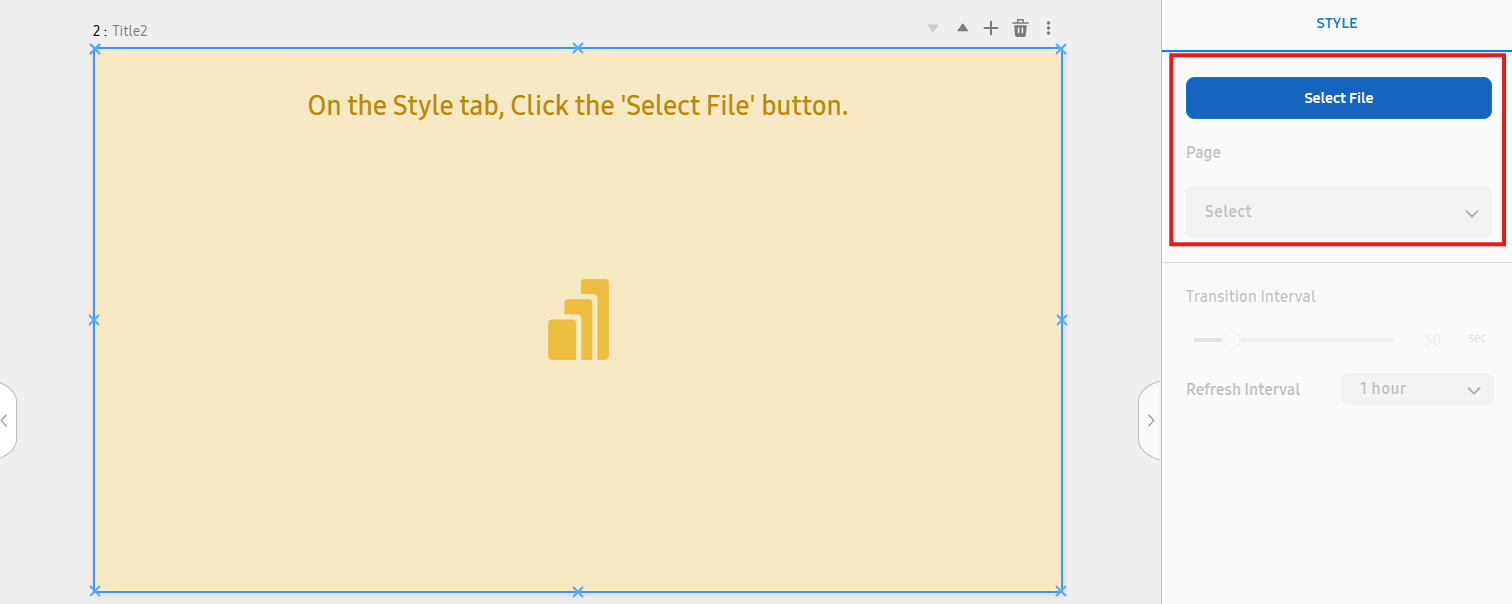
Open the Power BI file picker by clicking the Select File button.
The Power BI file picker displays reports and dashboard from the associated Power
BI account.
 |
Select a report or dashboard to be displayed and click Done button
-
To select a dashboard click the Type dropdown and select Dashboard.
-
To select a report or dashboard from a different workspace, click the workspace dropdown and select the desired workspace.
 |
After a file is selected, it will be displayed
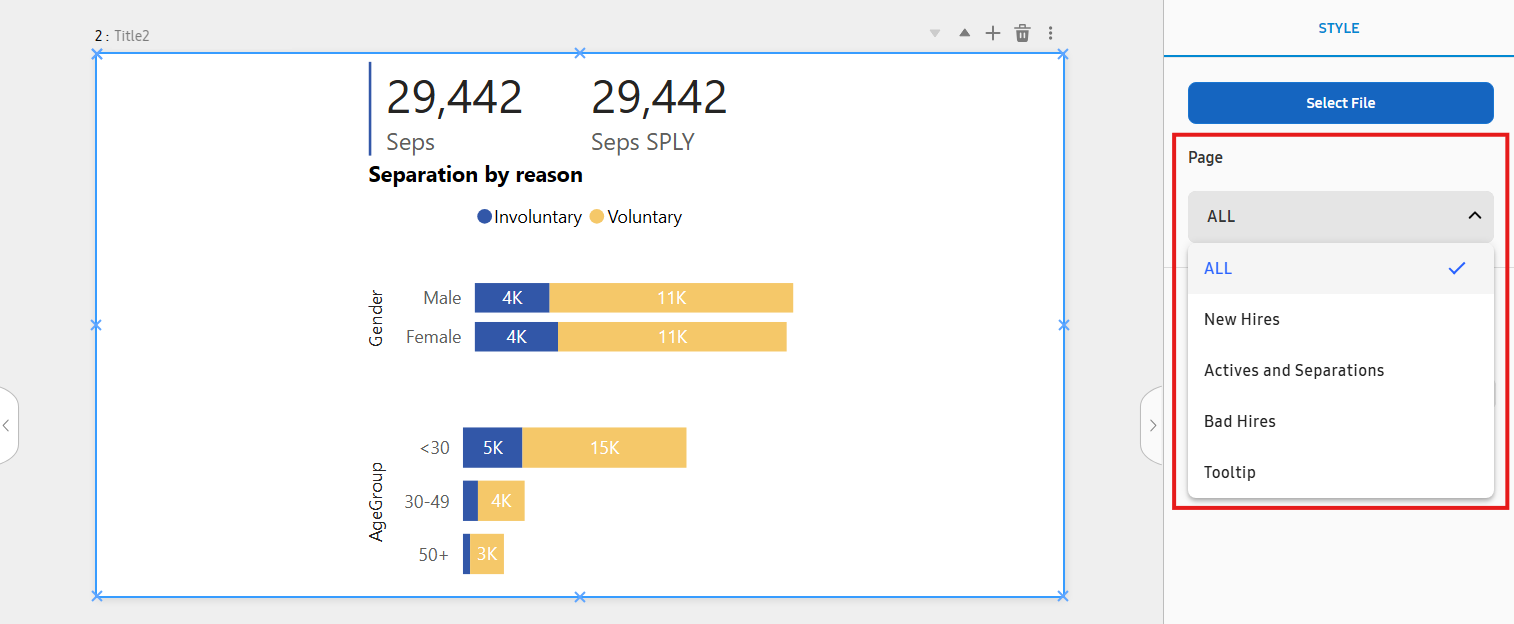
Specifying the Report Page
When selecting a report, it is possible to show all pages of the report or to show
a specified page. Follow the steps below to change the report page:
After selecting a report, Page dropdown will be available.
Click the dropdown and select the desired page to show.
 |
Specifying the Content Transition Interval and Refresh Interval
The Transition Interval can only be specified when report is selected AND Page dropdown is set to ALL.
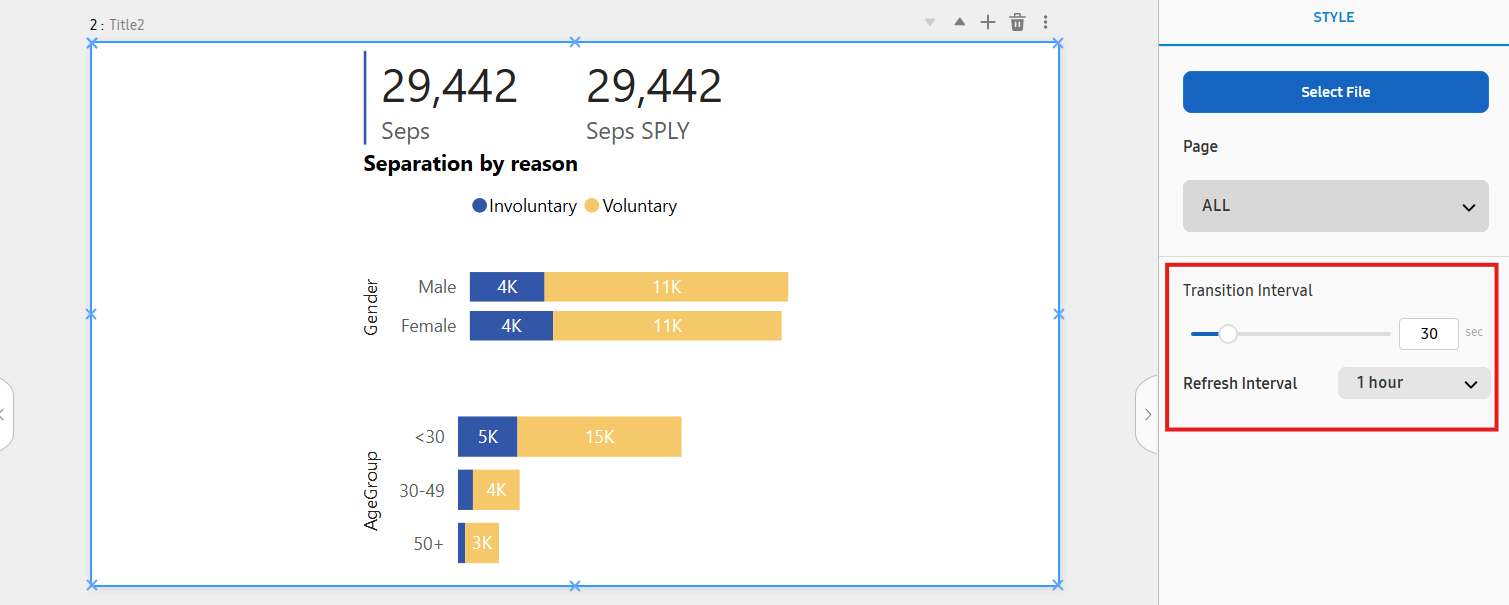 |
Transition Interval
Transition Interval is used to set the duration how long each page of the report is displayed. (15~100
seconds)
For example, if you set the Transition Interval to 10, each page is displayed for 10 seconds until it is changed to the next slide.
If only one page inside the report, the Transition Interval will not have an effect.
Refresh Interval
Refresh Interval is used to set the duration for the report or dashboard to be refreshed. (15 minutes~24
hours)
For example, if you set the Refresh Interval to 1 hour, the file refreshed every hour.